Dataviz Design System
Standardizing complex data representation through a comprehensive design system across four different podcast publishing and advertising products.
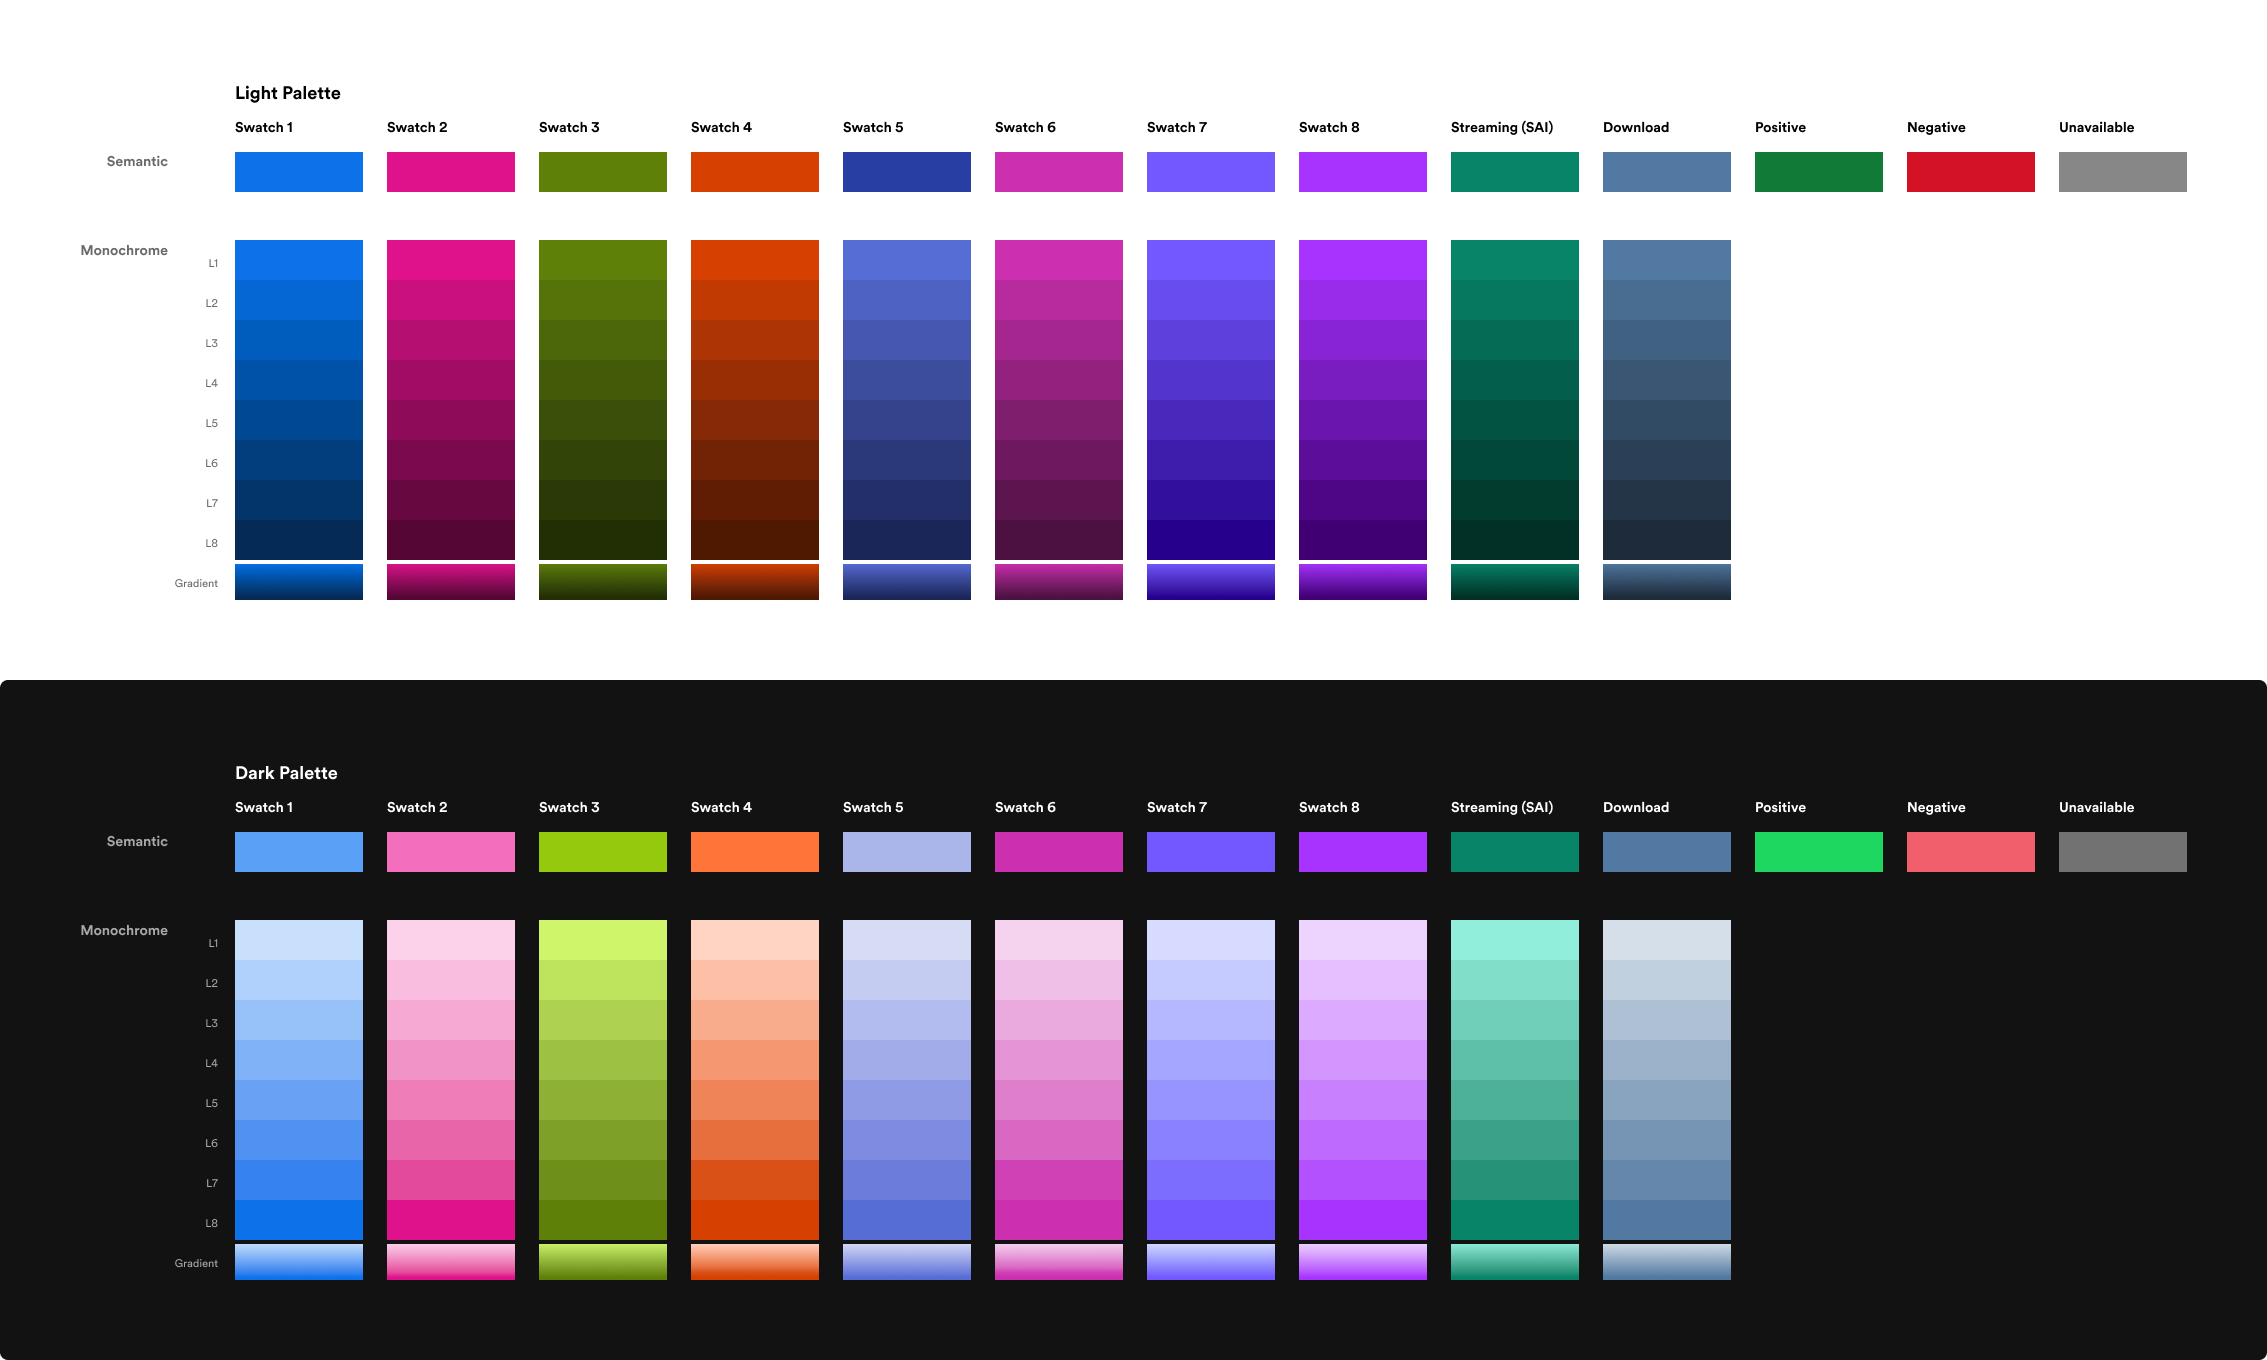
Pro tip: drag the arrow left and right to see light and dark modes in action.
THE PROBLEM
Our publishing B2B product faced the challenge of inconsistent data visualization experiences across its analytics and publisher tools. It not only affected our users, it also created inefficiency in our own design and engineering process. A unified charting experience was paramount to the future success and maturity of the ecosystem.
MY ROLE
Design Lead
SKILLS USED
Design Systems, UI Design, Design Strategy & Vision
THE IMPACT
The new design system has launched in alpha to select designers working on core reporting surfaces and will launch to the greater team as a beta in early 2024. This streamlined data visualization system has already led to reduced time spent designing and engineering charts, unified and consistent data representation across products, and foundational beginnings for contribution to our global design system for all product teams to utilize across complex consumer and creator experiences.
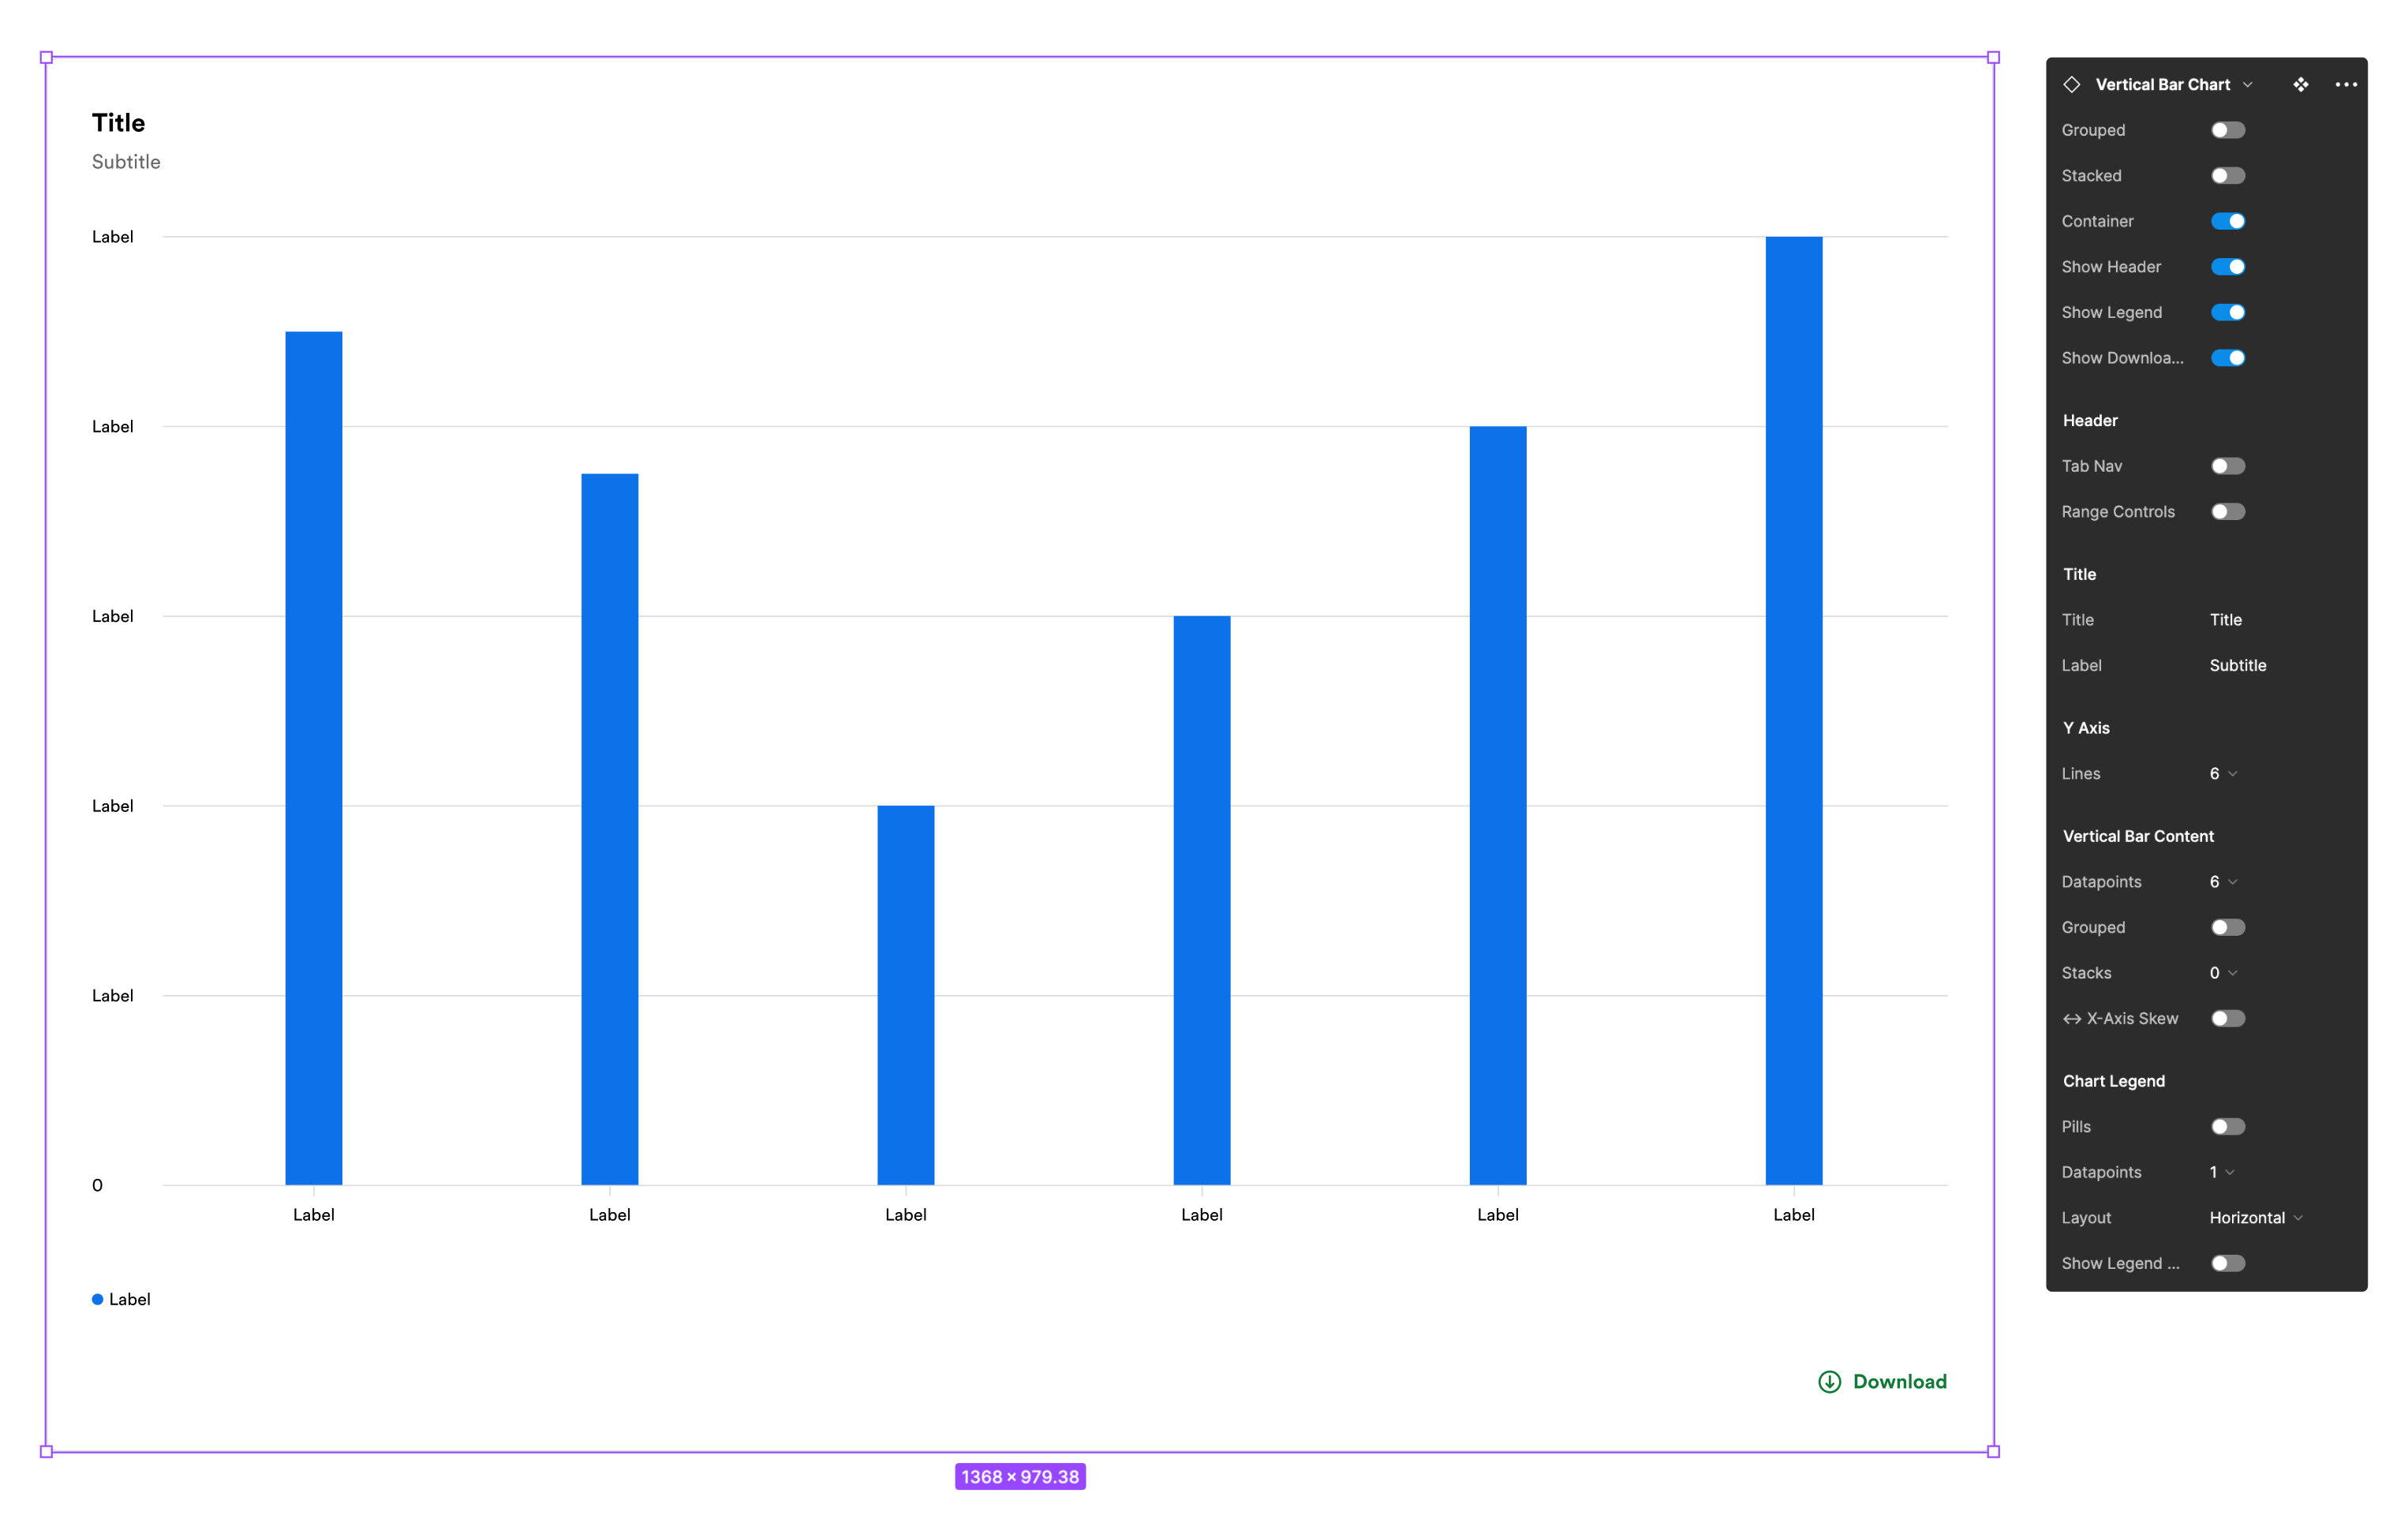
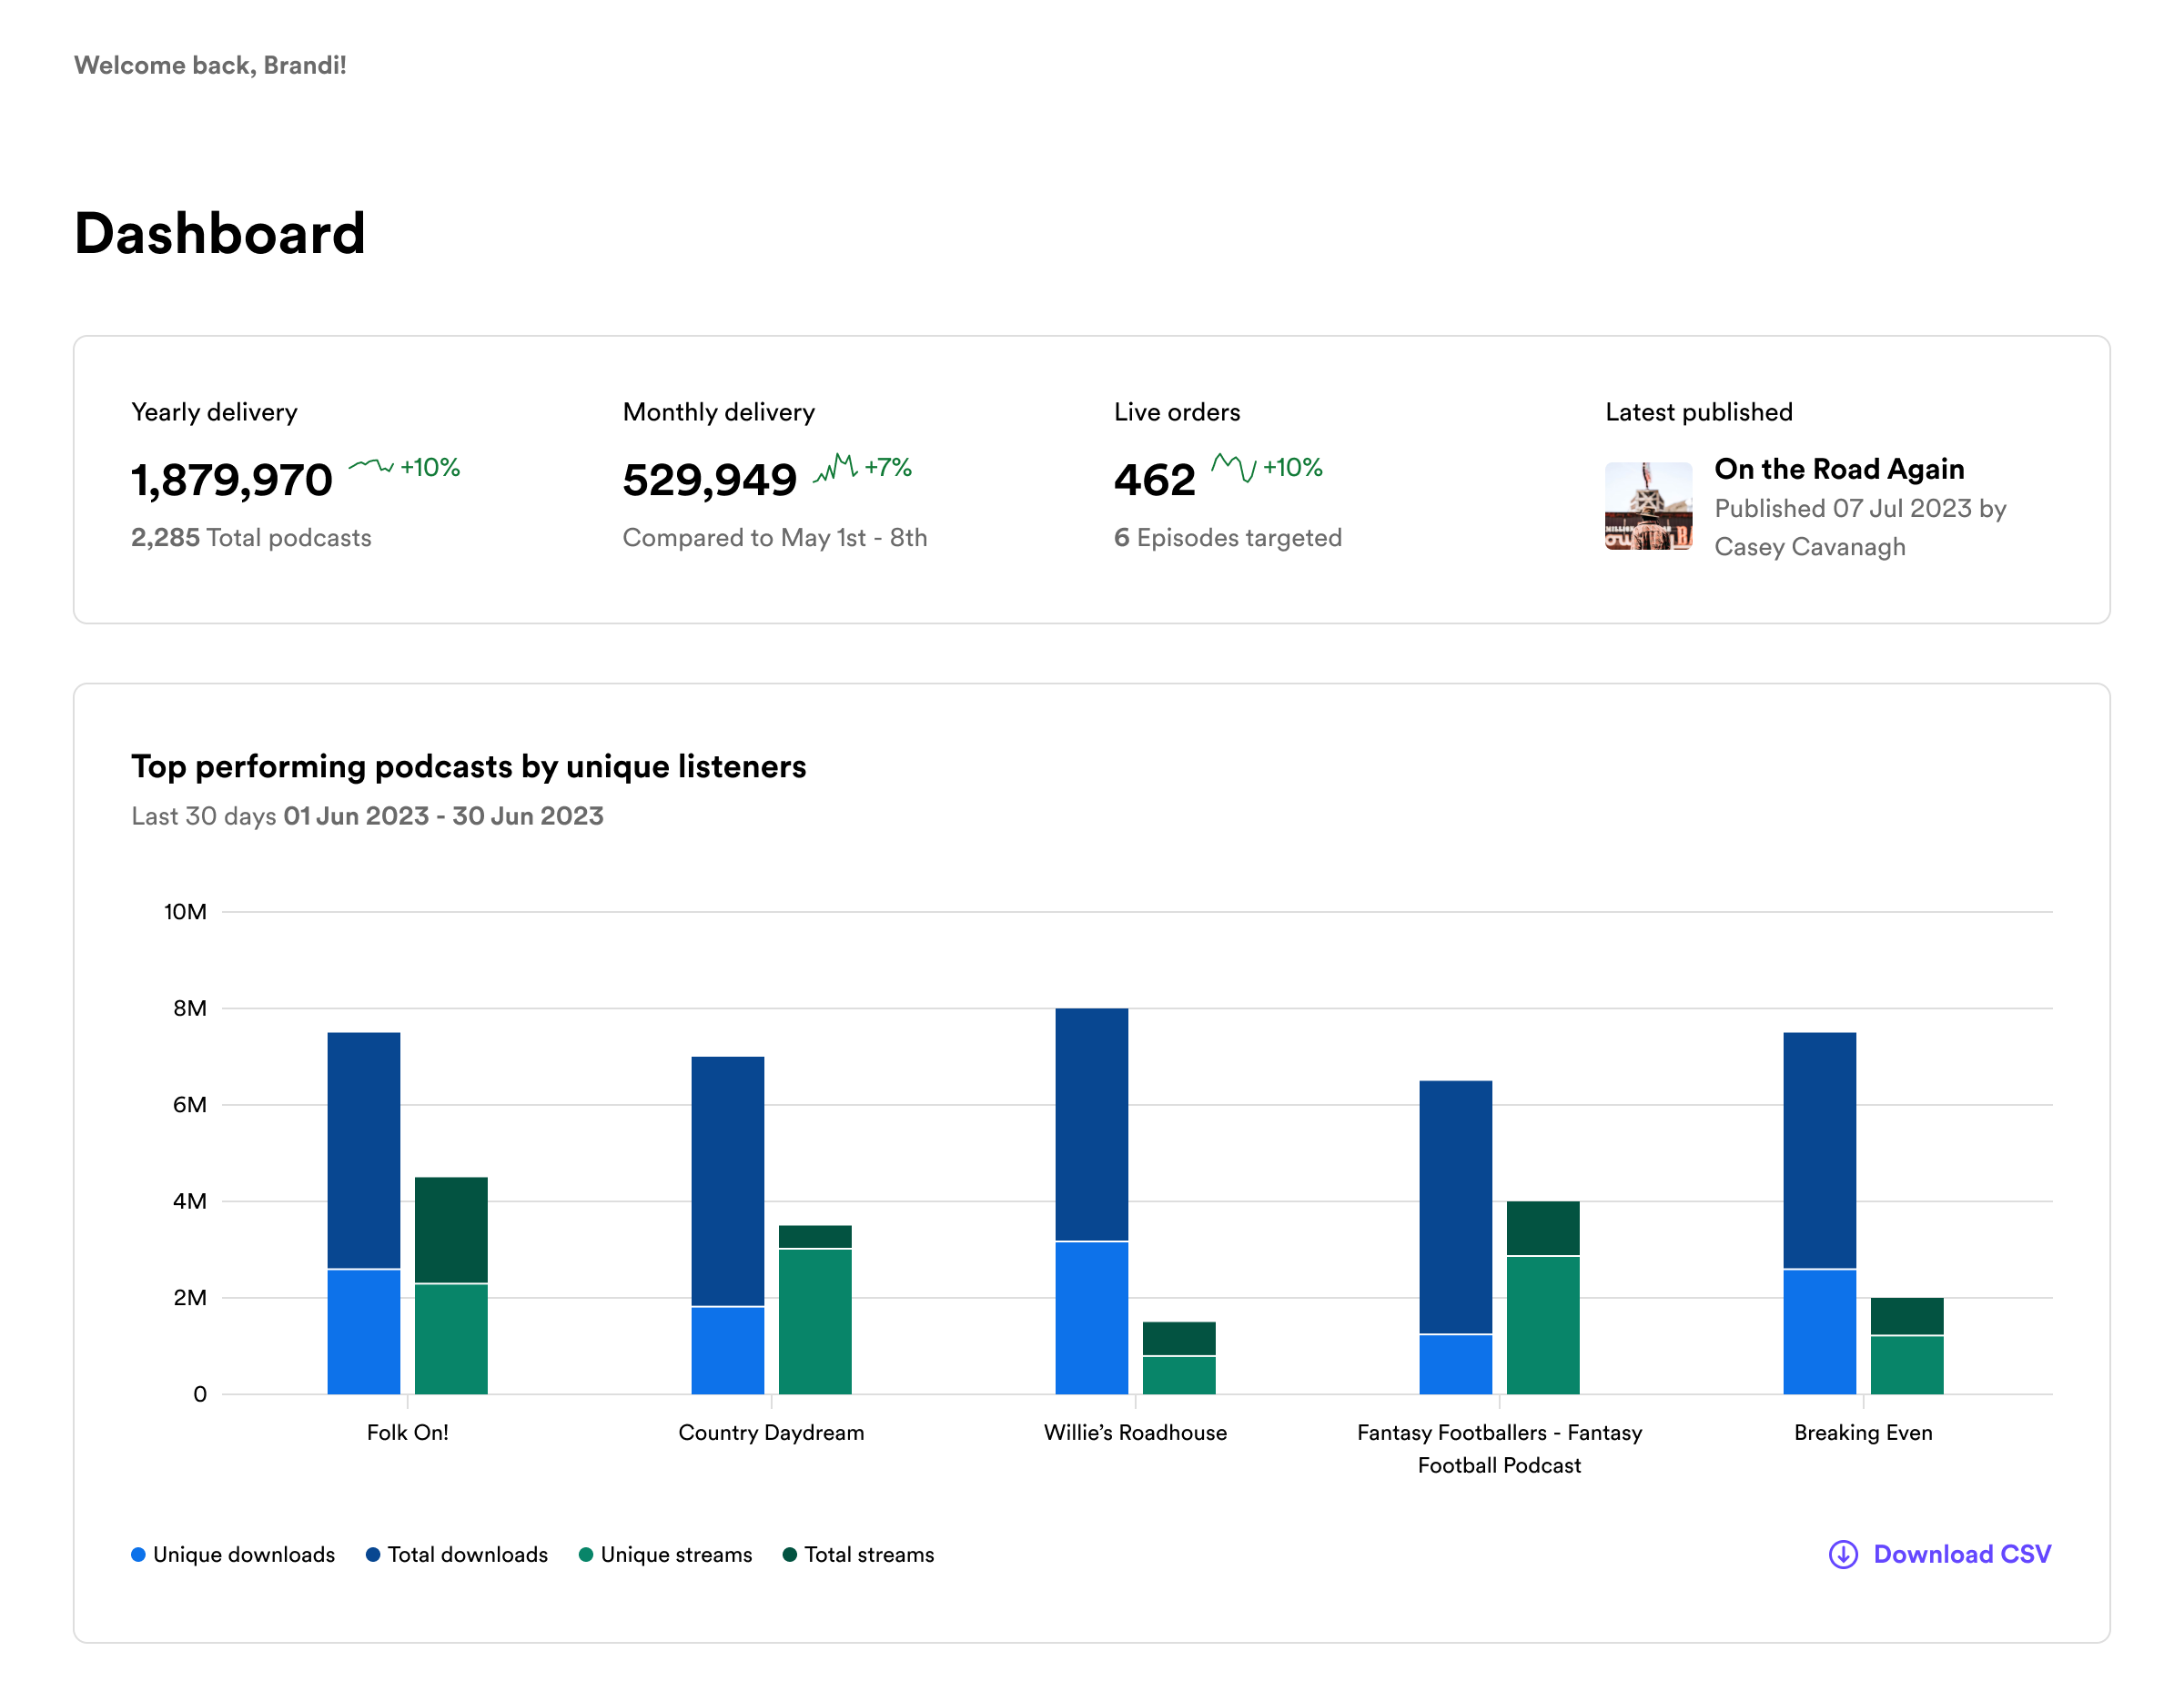
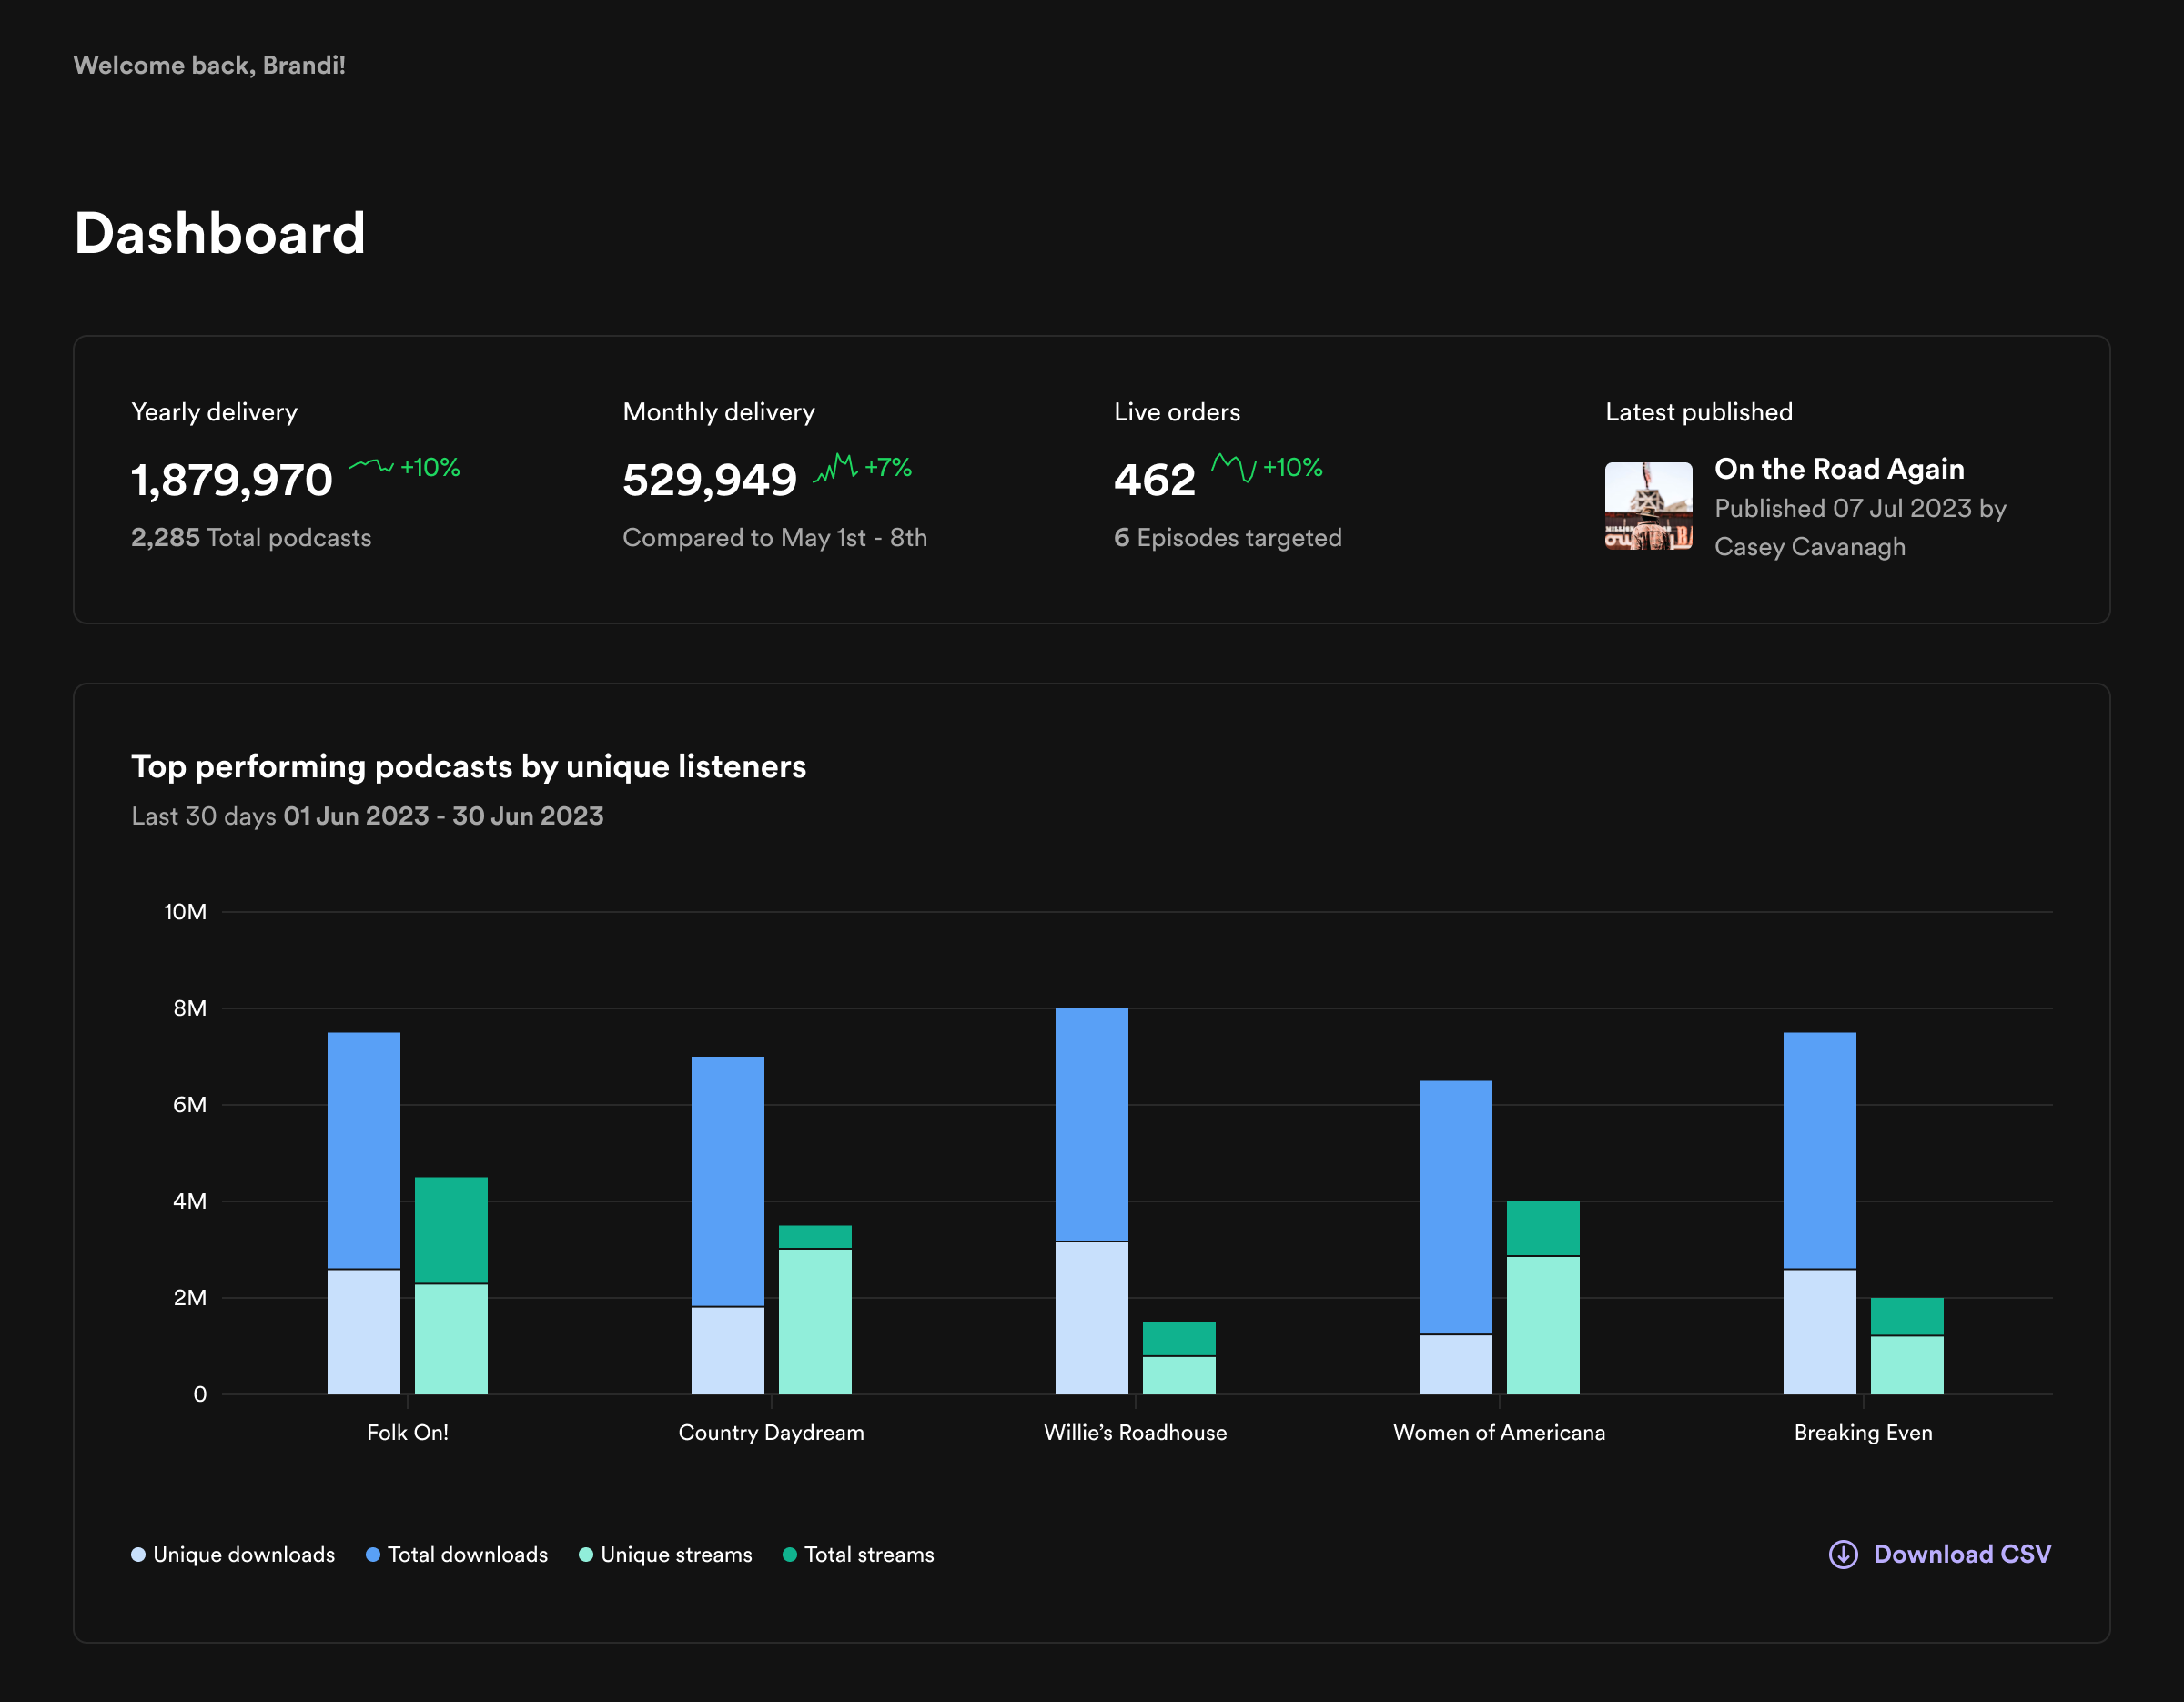
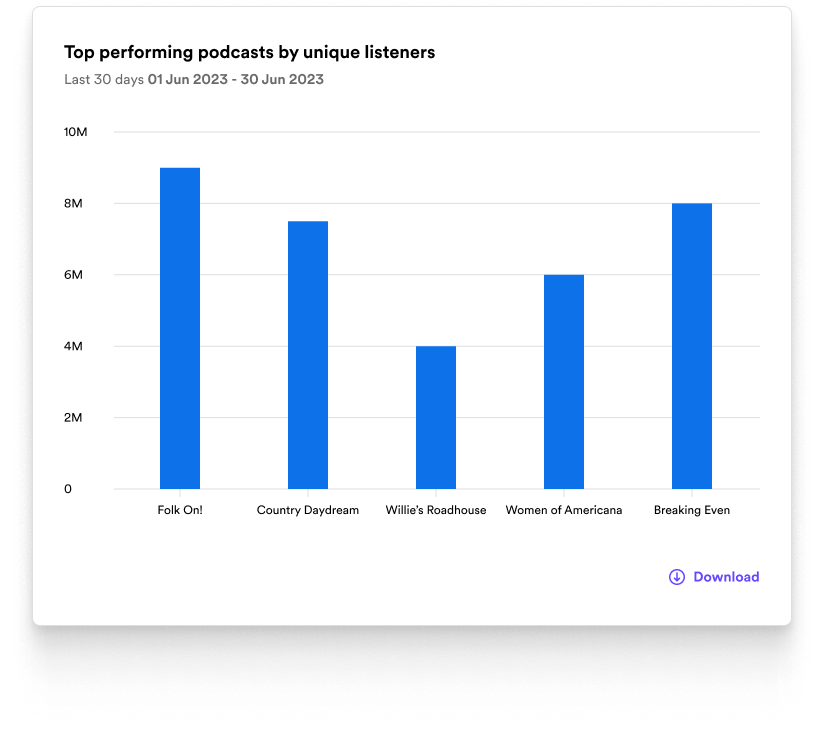
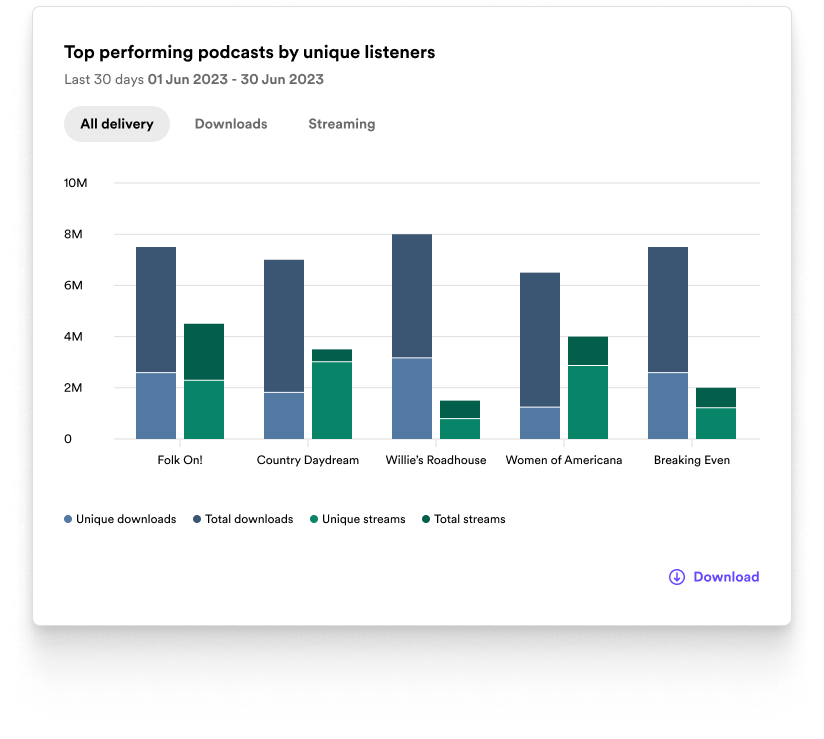
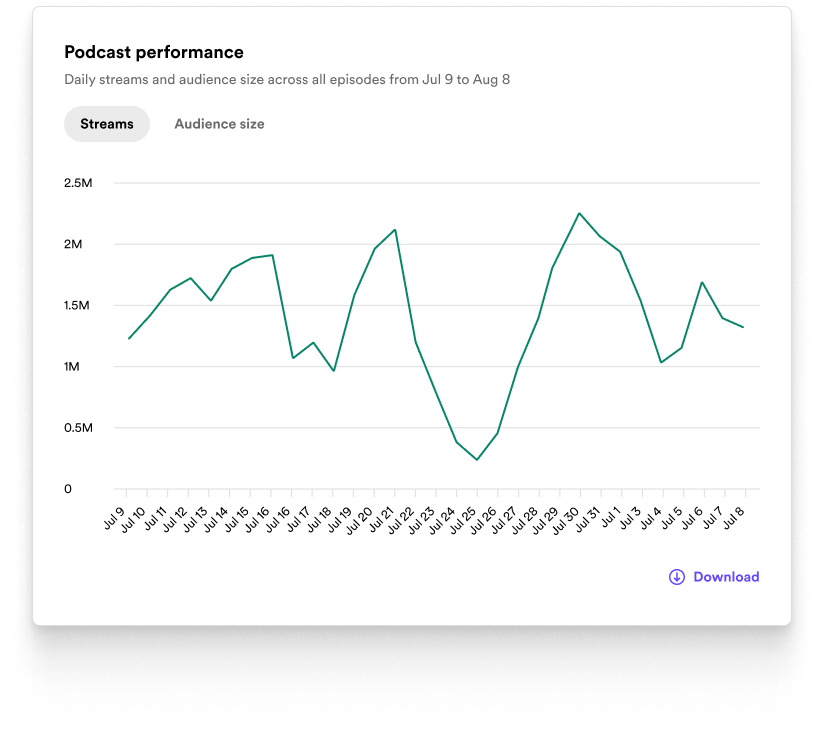
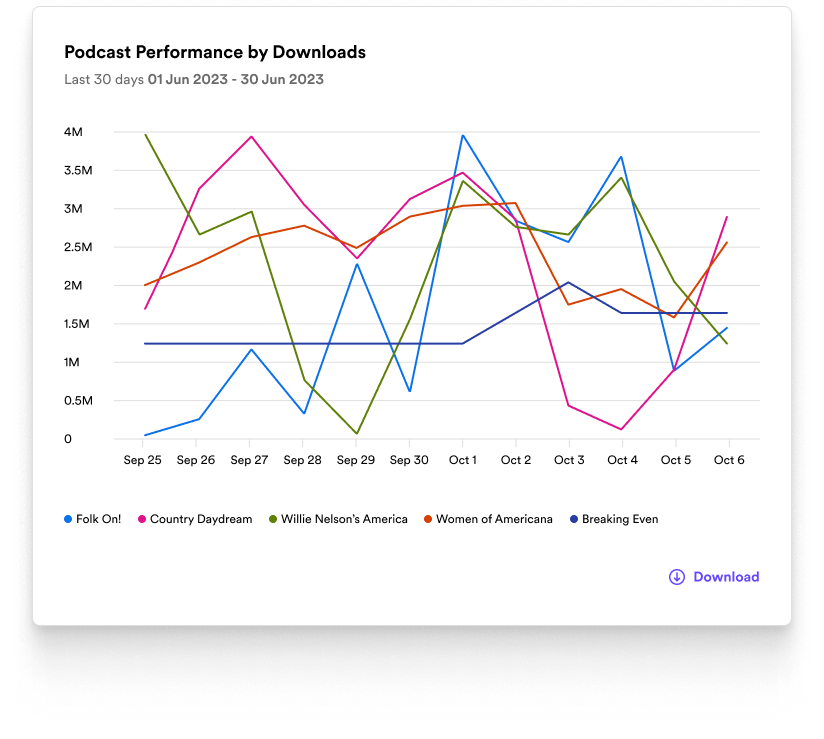
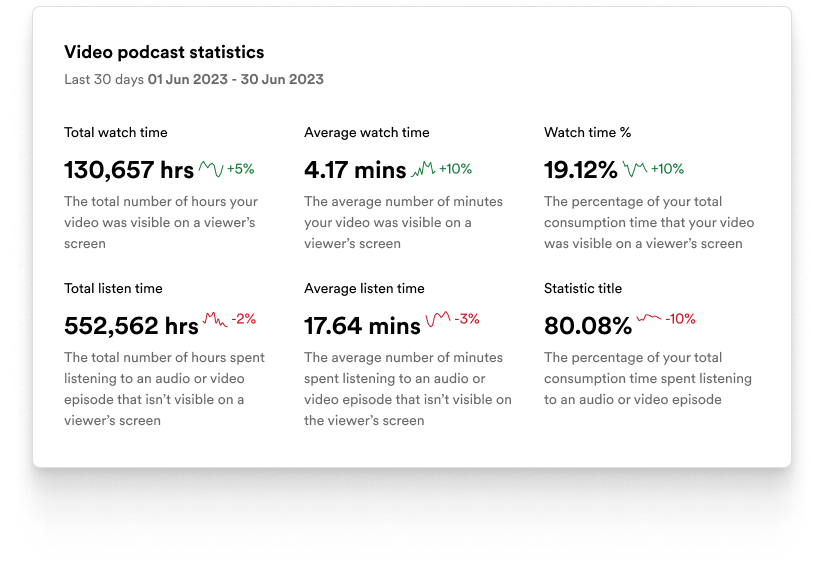
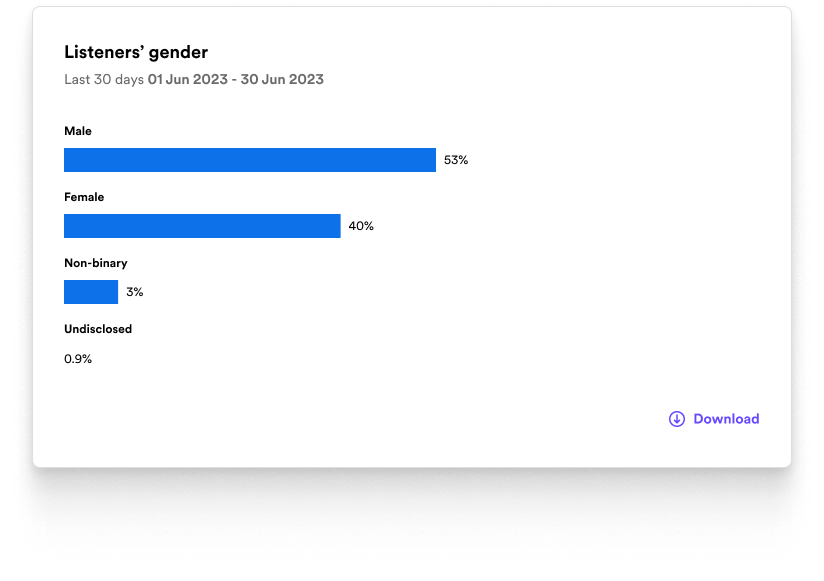
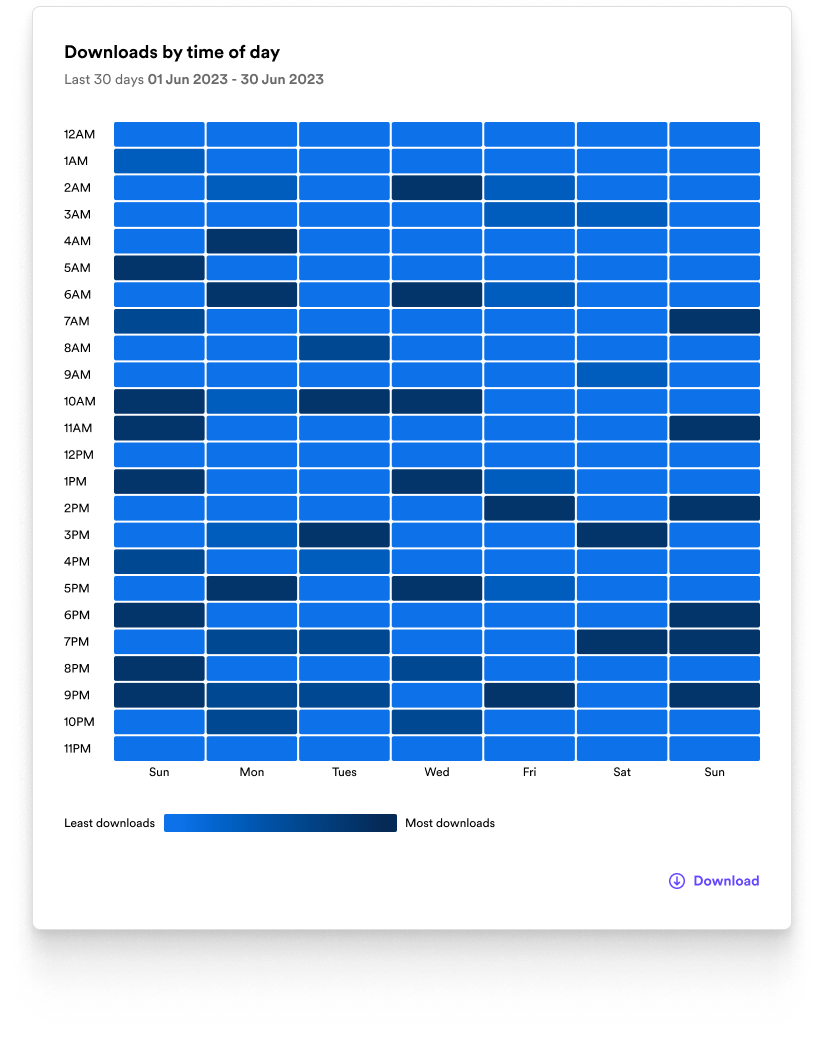
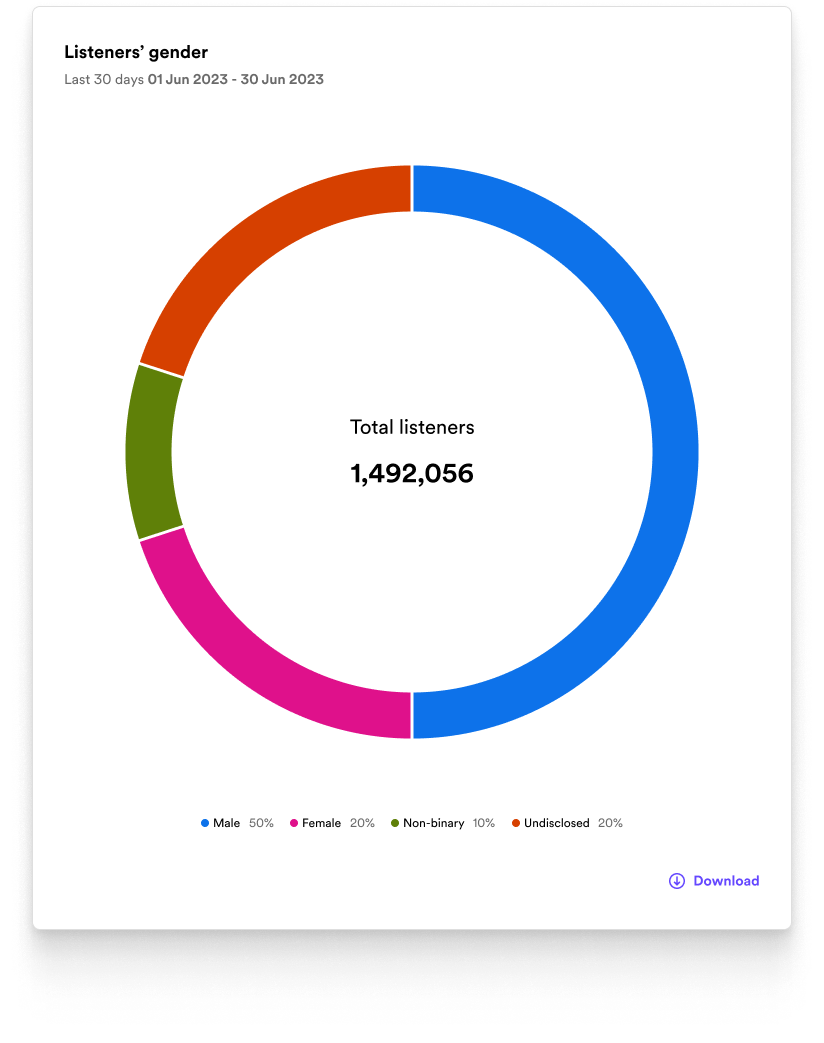
Chart examples
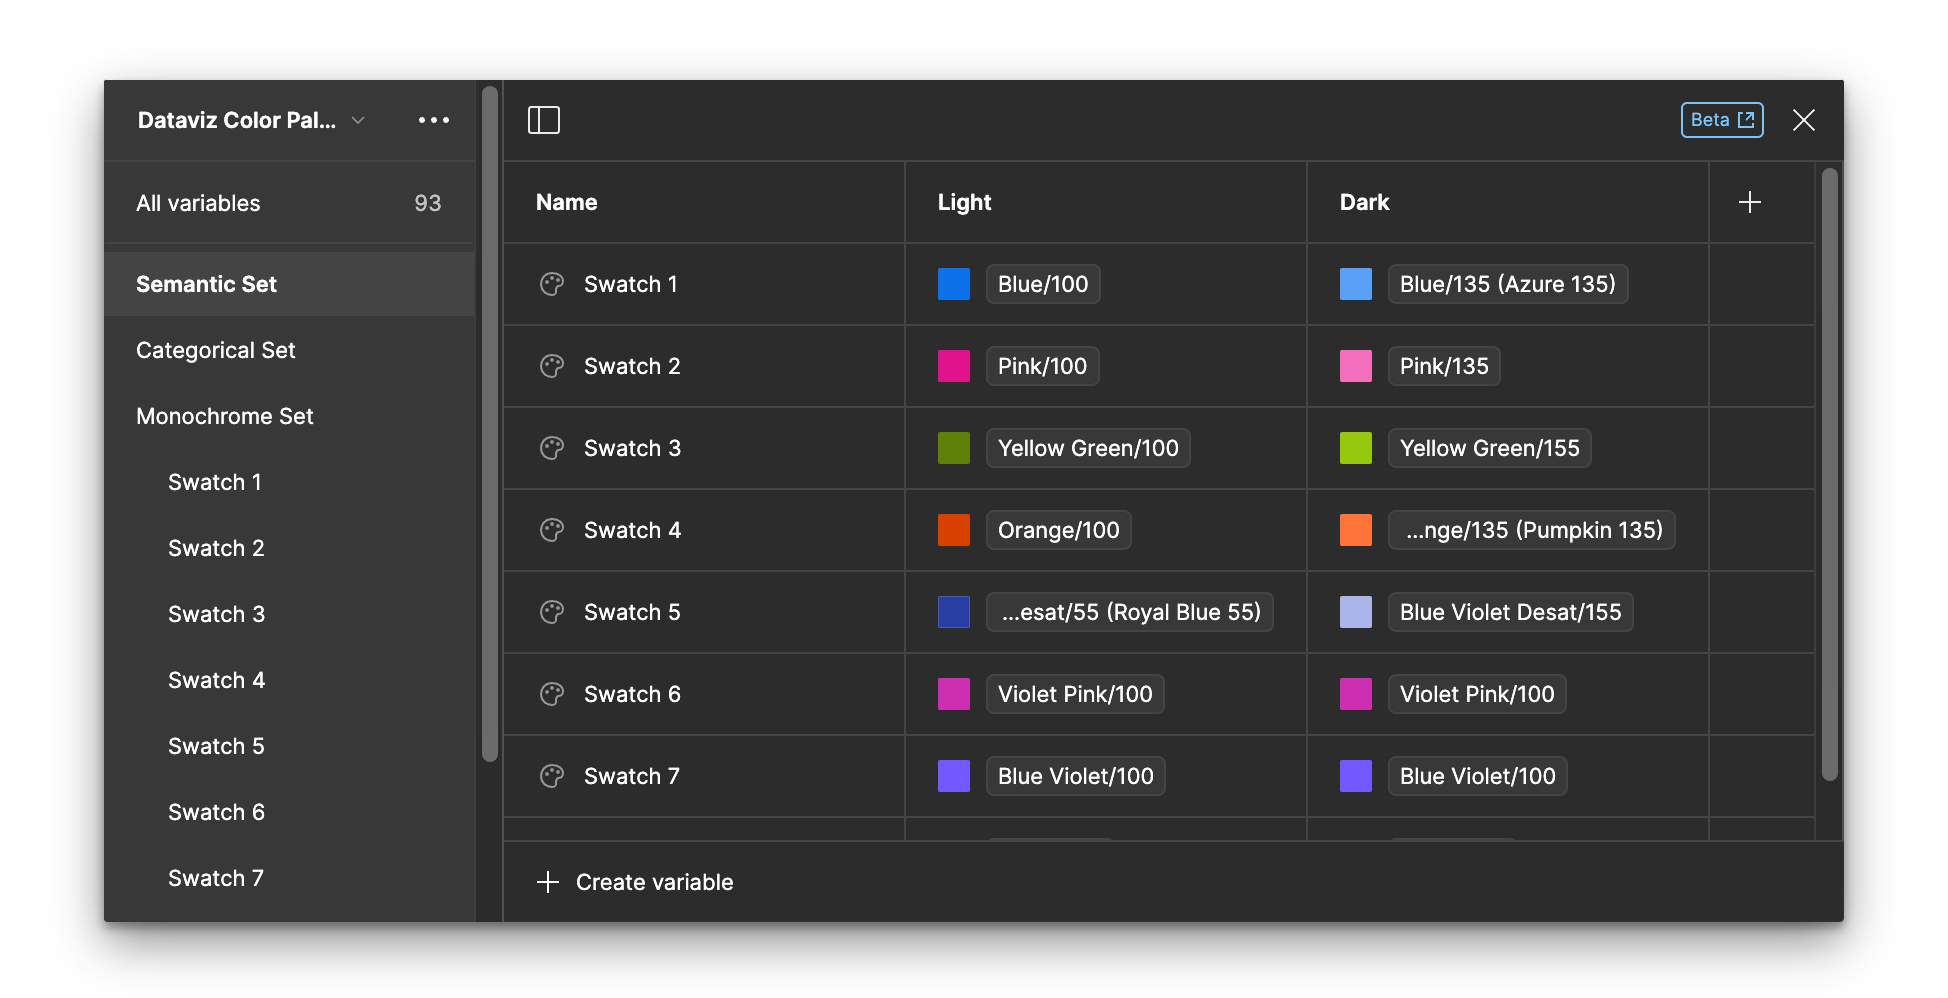
Figma library